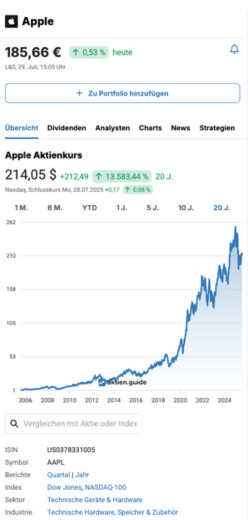
Siyata Mobile Inc Aktie
1,55 $
25,00 %
Nasdaq,
Fr, 06.02.2026
Siyata Mobile Inc Aktienkurs
1,55 $
-0,31
16,67 %
1 M.
-13,29
89,56 %
6 M.
-0,08
4,91 %
YTD
-16,97
91,63 %
1 J.
-85.325,65
100,00 %
3 J.
-5.543.998,45
100,00 %
5 J.
-11.692.798,45
100,00 %
10 J.
-707.412,85
100,00 %
20 J.
Nasdaq,
Schlusskurs Fr, 06.02.2026
+0,31
25,00 %
Powered by

ISIN
CA83013Q5095
Symbol
SYTA
Index
Sektor
Industrie
Kennzahlen
Basis
Marktkapitalisierung
-
Enterprise Value
-
Nettoverschuldung
positiv
Cash
6,5 Mio. $
Anzahl Aktien
12,1 Mio.
Bewertung (TTM | erwartet)
KGV
negativ | negativ
KUV
- | -
EV/Sales
- | -
EV/FCF
-
KBV
-
Finanzielle Stabilität
Eigenkapitalquote
26,3 %
Eigenkapitalrendite
-644,5 %
ROCE
-64,0 %
ROIC
-
Verschuldungsgrad
0,0
Mehr anzeigen
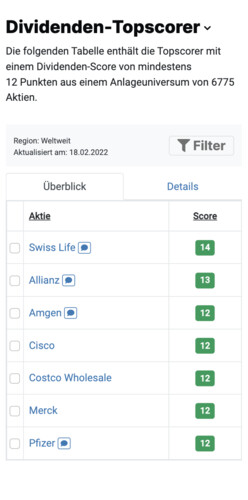
Ist Siyata Mobile Inc eine Topscorer-Aktie nach der Dividenden-, High-Growth-Investing- oder Levermann-Strategie?
Als kostenloser aktien.guide Basis-Nutzer kannst Du die Scores zu allen 7.083 weltweiten Aktien einsehen.
Siyata Mobile Inc Aktie Analyse
Scores kostenlos freischalten
Analystenmeinungen
6 Analysten haben eine Siyata Mobile Inc Prognose abgegeben:
Analystenmeinungen
6 Analysten haben eine Siyata Mobile Inc Prognose abgegeben:
Halten
50 %
Verkaufen
50 %
Finanzdaten von Siyata Mobile Inc
| Jun '25 |
+/-
%
|
||
| Umsatz | 12 12 |
49 %
49 %
|
|
| Bruttoertrag | 1,91 1,91 |
21 %
21 %
|
|
| EBITDA | -9,23 -9,23 |
5 %
5 %
|
|
| EBIT (Operatives Ergebnis) EBIT | -11 -11 |
4 %
4 %
|
|
| Nettogewinn | -17 -17 |
20 %
20 %
|
|
Angaben in Millionen USD.
Nichts mehr verpassen! Wir senden Dir alle News zur Siyata Mobile Inc-Aktie direkt und kostenlos in Deine Mailbox.
Auf Wunsch erhältst Du jeden Morgen pünktlich zum Frühstück eine E-Mail, die alle für Dich relevanten Aktien-News enthält.
Siyata Mobile Inc Aktie News
Neutral
PRNewsWire
●
6 Monate alt
Event teams to rely on Siyata's mission-critical handsets and ESChat platform for event-wide connectivity in remote Nevada desert VANCOUVER, BC , Aug. 25, 2025 /PRNewswire/ -- Siyata Mobile Inc. (Nasdaq: SYTA, SYTAW) ("Siyata" or the "Company"), a global developer and vendor of mission-critical Push-to-Talk over Cellular (PoC) handsets and accessories, and ESChat, a provider of mission-critica...
Neutral
PRNewsWire
●
6 Monate alt
VANCOUVER, BC , Aug. 14, 2025 /PRNewswire/ -- Siyata Mobile Inc. (Nasdaq: SYTA) ("Siyata" or the "Company"), a global developer and vendor of mission-critical Push-to-Talk over Cellular (PoC) handsets and accessories, today announced its financial results for the three months ended June 30, 2025. These financial results pertain exclusively to Siyata Mobile Inc. and do not reflect or include any...
Neutral
PRNewsWire
●
6 Monate alt
VANCOUVER, BC , Aug. 11, 2025 /PRNewswire/ -- Siyata Mobile Inc. (Nasdaq: SYTA, SYTAW) ("Siyata" or the "Company"), a global developer and vendor of mission-critical Push-to-Talk over Cellular (PoC) handsets and accessories, today announced that it plans to release its financial results for the second quarter ended June 30, 2025, on or around Thursday, August 14, 2025, after the market closes. ...
Firmenprofil
| Hauptsitz | USA |
| CEO | Marc Seelenfreund |
| Mitarbeiter | 23 |
| Gegründet | 1986 |
| Webseite | www.siyatamobile.com |
Kostenlos registrieren
aktien.guide ist das Tool zum einfachen Finden, Analysieren und Beobachten von Aktien. Lerne von erfolgreichen Investoren und triff fundierte Anlageentscheidungen. Wir machen Dich zum selbstbestimmten Investor.