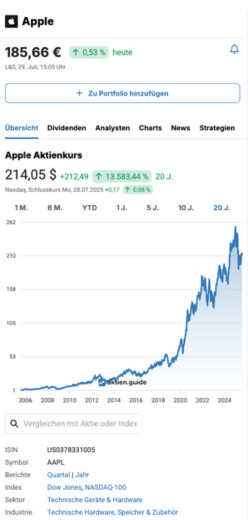
Qilian International Holding Group ltd Aktie
1,14 $
6,56 %
Nasdaq,
6. Februar, 22:00 Uhr
Qilian International Holding Group ltd Aktienkurs
1,14 $
-2,74
70,62 %
1 M.
-7,05
86,08 %
6 M.
-2,55
69,11 %
YTD
-10,26
90,00 %
1 J.
-5,70
83,34 %
3 J.
-33,41
96,70 %
5 J.
-3,86
77,20 %
10 J.
-3,86
77,20 %
20 J.
Nasdaq,
Schlusskurs Fr, 06.02.2026
-0,08
6,56 %
Powered by

ISIN
KYG7307E1070
Symbol
BGM
Index
Industrie
Kennzahlen
Basis
Marktkapitalisierung
209,7 Mio. $
Enterprise Value
196,8 Mio. $
Nettoverschuldung
positiv
Cash
14,5 Mio. $
Anzahl Aktien
98,3 Mio.
Bewertung (TTM | erwartet)
KGV
negativ | -
KUV
7,8 | -
EV/Sales
7,3 | -
EV/FCF
negativ
KBV
1,2
Dividende
Dividende je Aktie
0,00 $
Rendite 1J. | 5J.
0,0 % | 0,0 %
Wachstum 1J | 5J
- | -
Payout 1J | 3J
0,0 % | -19,8 %
Erhöhungen
0 Jahre
Mehr anzeigen
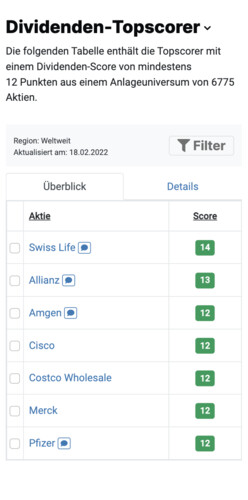
Ist Qilian International Holding Group ltd eine Topscorer-Aktie nach der Dividenden-, High-Growth-Investing- oder Levermann-Strategie?
Als kostenloser aktien.guide Basis-Nutzer kannst Du die Scores zu allen 7.083 weltweiten Aktien einsehen.
Finanzdaten von Qilian International Holding Group ltd
| Mär '25 |
+/-
%
|
||
| Umsatz | 27 27 |
10 %
10 %
|
|
| Bruttoertrag | 5,21 5,21 |
499 %
499 %
|
|
| EBITDA | -1 -1 |
50 %
50 %
|
|
| EBIT (Operatives Ergebnis) EBIT | -2,12 -2,12 |
39 %
39 %
|
|
| Nettogewinn | -2,72 -2,72 |
65 %
65 %
|
|
Angaben in Millionen USD.
Nichts mehr verpassen! Wir senden Dir alle News zur Qilian International Holding Group ltd-Aktie direkt und kostenlos in Deine Mailbox.
Auf Wunsch erhältst Du jeden Morgen pünktlich zum Frühstück eine E-Mail, die alle für Dich relevanten Aktien-News enthält.
Qilian International Holding Group ltd Aktie News
Positiv
Seeking Alpha
●
5 Monate alt
32.7% of BGM's revenue is now from high-growth AI, pushing profit up 78%. Yet, the market still values it like a slow-moving API business. With β ≈ 0.04–0.05 and basically no leverage, you get CAPM ≈ 4.42% and WACC ≈ 4.41%, that math checks out. On my assumptions, the DCF lands at about $19.07 per share. Versus the current $8.93, that's roughly +113% upside—consistent with the "undervalued" call.
Firmenprofil
| Hauptsitz | Cayman-Inseln |
| CEO | Chen Xin |
| Gegründet | 2019 |
| Webseite | www.bgmgroupltd.com |
Kostenlos registrieren
aktien.guide ist das Tool zum einfachen Finden, Analysieren und Beobachten von Aktien. Lerne von erfolgreichen Investoren und triff fundierte Anlageentscheidungen. Wir machen Dich zum selbstbestimmten Investor.