Global Industrial Co Aktie
32,70 $
1,54 %
vorgestern
NYSE,
6. Februar, 22:00 Uhr
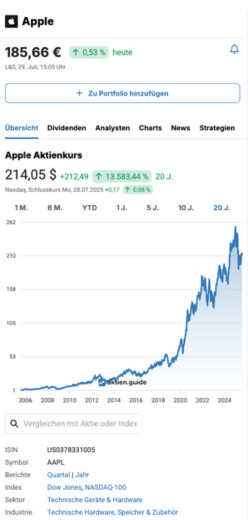
Global Industrial Co Aktienkurs
32,68 $
+2,48
8,21 %
1 M.
-1,57
4,58 %
6 M.
+3,46
11,84 %
YTD
+8,62
35,83 %
1 J.
+4,46
15,80 %
3 J.
-10,15
23,70 %
5 J.
+27,25
502,10 %
10 J.
+29,00
786,93 %
20 J.
NYSE,
Schlusskurs Fr, 06.02.2026
+0,48
1,49 %
Powered by

ISIN
US37892E1029
Symbol
GIC
Index
Sektor
Industrie
Kennzahlen
Basis
Marktkapitalisierung
1,3 Mrd. $
Enterprise Value
1,2 Mrd. $
Nettoverschuldung
positiv
Cash
67,2 Mio. $
Anzahl Aktien
38,5 Mio.
Bewertung (TTM | erwartet)
KGV
18,5 | 17,6
KUV
0,9 | 0,9
EV/Sales
0,9 | 0,9
EV/FCF
16,9
KBV
4,0
Dividende
Dividende je Aktie
1,04 $
Rendite 1J. | 5J.
3,2 % | 2,6 %
Wachstum 1J | 5J
4,0 % | 15,0 %
Payout 1J | 3J
63,3 % | 46,0 %
Erhöhungen
10 Jahre
Mehr anzeigen
Ist Global Industrial Co eine Topscorer-Aktie nach der Dividenden-, High-Growth-Investing- oder Levermann-Strategie?
Als kostenloser aktien.guide Basis-Nutzer kannst Du die Scores zu allen 7.083 weltweiten Aktien einsehen.
Global Industrial Co Aktie Analyse
Scores kostenlos freischalten
Analystenmeinungen
8 Analysten haben eine Global Industrial Co Prognose abgegeben:
Analystenmeinungen
8 Analysten haben eine Global Industrial Co Prognose abgegeben:
Halten
38 %
Verkaufen
63 %
Finanzdaten von Global Industrial Co
| Sep '25 |
+/-
%
|
||
| Umsatz | 1.336 1.336 |
0 %
0 %
|
|
| Bruttoertrag | 473 473 |
3 %
3 %
|
|
| EBITDA | 100 100 |
6 %
6 %
|
|
| EBIT (Operatives Ergebnis) EBIT | 93 93 |
7 %
7 %
|
|
| Nettogewinn | 68 68 |
4 %
4 %
|
|
Angaben in Millionen USD.
Nichts mehr verpassen! Wir senden Dir alle News zur Global Industrial Co-Aktie direkt und kostenlos in Deine Mailbox.
Auf Wunsch erhältst Du jeden Morgen pünktlich zum Frühstück eine E-Mail, die alle für Dich relevanten Aktien-News enthält.
Global Industrial Co Aktie News
Neutral
Accesswire
●
etwa ein Monat alt
Engineered to absorb impact, reduce floor damage, and decrease maintenance costs PORT WASHINGTON, NY / ACCESS Newswire / January 6, 2026 / Global Industrial Company (NYSE:GIC), a value-added national distributor and source for industrial equipment and supplies, has announced the launch of its newest Global Industrial Exclusive Brand™ solution: the Global Industrial™ Plastic Guard Rail. The Glob...
Neutral
Accesswire
●
3 Monate alt
- Self-propelled, semi-autonomous unit designed to securely and safely wrap irregular and oversized loads, increase productivity and reduce stretch wrap waste - PORT WASHINGTON, NY / ACCESS Newswire / November 17, 2025 / Global Industrial Company (NYSE:GIC), a value-added national distributor and source for industrial equipment and supplies, today announced the launch of the Global Industrial™ ...
Neutral
Accesswire
●
3 Monate alt
PORT WASHINGTON, NY / ACCESS Newswire / November 6, 2025 / Global Industrial Company (NYSE:GIC), a value-added national distributor and source for industrial equipment and supplies, today announced that Tex Clark, Senior Vice President and Chief Financial Officer, will be attending the Stephens NASH25 Conference on November 18, 2025, and the 17th Annual Southwest IDEAS Conference on November 20...
Firmenprofil
| Hauptsitz | USA |
| CEO | Anesa Chaibi |
| Mitarbeiter | 1.845 |
| Gegründet | 1949 |
| Webseite | www.globalindustrial.com |
Kostenlos registrieren
aktien.guide ist das Tool zum einfachen Finden, Analysieren und Beobachten von Aktien. Lerne von erfolgreichen Investoren und triff fundierte Anlageentscheidungen. Wir machen Dich zum selbstbestimmten Investor.