 BlackRock Science and Technology Trust Aktie
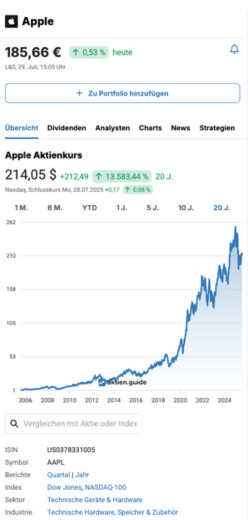
39,54 $
2,36 %
vorgestern
NYSE,
6. Februar, 22:10 Uhr
BlackRock Science and Technology Trust Aktienkurs
39,56 $
-1,20
2,94 %
1 M.
+0,12
0,30 %
6 M.
-0,98
2,42 %
YTD
+1,19
3,10 %
1 J.
+6,94
21,28 %
3 J.
-17,43
30,59 %
5 J.
+25,53
182,01 %
10 J.
+20,20
104,32 %
20 J.
NYSE,
Schlusskurs Fr, 06.02.2026
+0,93
2,41 %
Powered by

Insights zu BlackRock Science and Technology Trust
Insights

Womit verdient das Unternehmen sein Geld?
Wer sind die wichtigsten Wettbewerber?
Was sind die Chancen und Risiken?
Wie wird das Unternehmen geführt?
Kennzahlen
Basis
Marktkapitalisierung
1,4 Mrd. $
Enterprise Value
1,4 Mrd. $
Nettoverschuldung
positiv
Cash
50,0 Tsd. $
Anzahl Aktien
35,0 Mio.
Bewertung (TTM | erwartet)
KGV
8,3 | -
KUV
266,1 | -
EV/Sales
266,1 | -
EV/FCF
13,4
KBV
1,0
Dividende
Dividende je Aktie
4,20 $
Rendite 1J. | 5J.
10,6 % | 8,8 %
Wachstum 1J | 5J
40,0 % | 16,2 %
Payout 1J | 3J
38,6 % | -253,5 %
Erhöhungen
1 Jahr
Mehr anzeigen
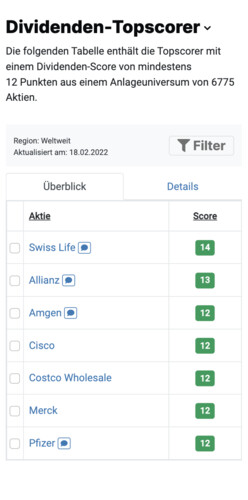
Ist BlackRock Science and Technology Trust eine Topscorer-Aktie nach der Dividenden-, High-Growth-Investing- oder Levermann-Strategie?
Als kostenloser aktien.guide Basis-Nutzer kannst Du die Scores zu allen 7.083 weltweiten Aktien einsehen.
Finanzdaten von BlackRock Science and Technology Trust
| Jun '25 |
+/-
%
|
||
| Umsatz | 5,22 5,22 |
36 %
36 %
|
|
| Bruttoertrag | -8,26 -8,26 |
2 %
2 %
|
|
| EBITDA | - - |
-
|
|
| EBIT (Operatives Ergebnis) EBIT | -9,16 -9,16 |
0 %
0 %
|
|
| Nettogewinn | 166 166 |
38 %
38 %
|
|
Angaben in Millionen USD.
Nichts mehr verpassen! Wir senden Dir alle News zur BlackRock Science and Technology Trust-Aktie direkt und kostenlos in Deine Mailbox.
Auf Wunsch erhältst Du jeden Morgen pünktlich zum Frühstück eine E-Mail, die alle für Dich relevanten Aktien-News enthält.
BlackRock Science and Technology Trust Aktie News
Neutral
Seeking Alpha
●
3 Tage alt
My income portfolio prioritizes resilient, high-dividend securities with long-term positive NAV trends rather than trading based on unpredictable short-term price movements. Therefore, I focus on funds that have demonstrated value creation since launch, especially those with at least a decade of performance history, with its accompanying ups and downs. In this article, I show how the NAVs of al...
Positiv
Seeking Alpha
●
5 Tage alt
The Dividend Harvesting Portfolio reached $34,941.98, up 35.96% on invested capital with a 7.93% yield and strong dividend growth. Recent additions to STWD and NNN REIT reflect conviction in high-yield REITs and triple net lease structures amid expectations for lower rates. Portfolio diversification across 40 positions and multiple sectors has supported resilience through volatile markets and e...
Neutral
Business Wire
●
9 Tage alt
NEW YORK--(BUSINESS WIRE)---- $BBN--Today, BlackRock Resources & Commodities Strategy Trust (NYSE: BCX), BlackRock Enhanced Equity Dividend Trust (NYSE: BDJ), BlackRock Energy and Resources Trust (NYSE: BGR), BlackRock Enhanced International Dividend Trust (NYSE: BGY), BlackRock Health Sciences Trust (NYSE: BME), BlackRock Health Sciences Term Trust (NYSE: BMEZ), BlackRock Enhanced Global Divid...
Firmenprofil
| Hauptsitz | USA |
| CEO | John Perlowski |
| Gegründet | 2014 |
| Webseite | www.blackrock.com |
Kostenlos registrieren
aktien.guide ist das Tool zum einfachen Finden, Analysieren und Beobachten von Aktien. Lerne von erfolgreichen Investoren und triff fundierte Anlageentscheidungen. Wir machen Dich zum selbstbestimmten Investor.